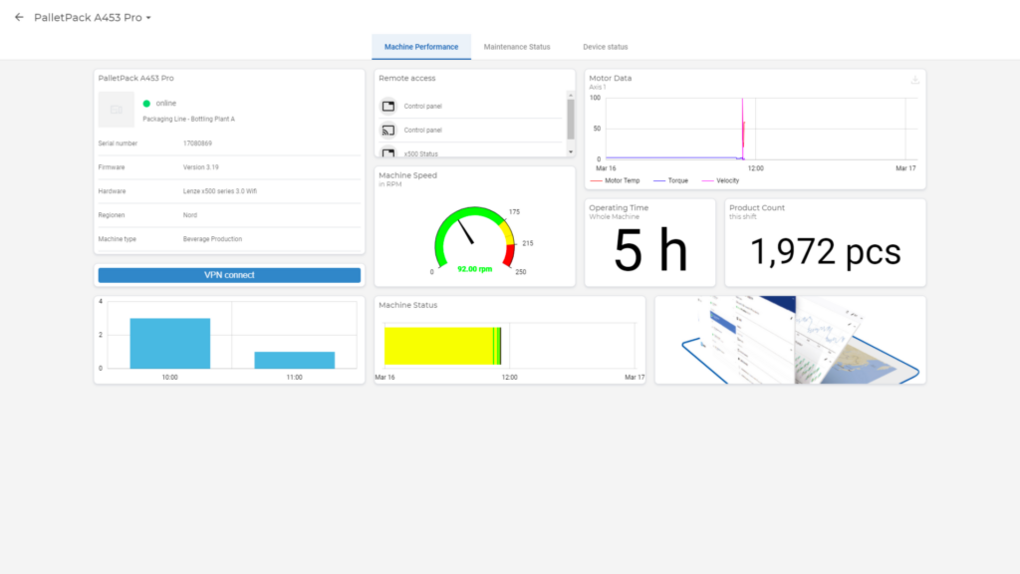
Visualize your data
Set-Up Cloud Logging
This article assumes you've already activated Cloud Logging (or started the 30 day free trial), have set up a data source (including variables) and log your data. View our corresponding guides if you haven't yet.
The fourth step in Cloud Logging is visualising or exporting your data. Visualisation does not affect your Cloud Logging credit (data points per hour). However, the configuration of your data tags, i.e. the effectively logged data, does. There are two ways to visualize your data: Through data reports and through live monitoring.
Data reports
Data reports show your historical data. You can choose what time period you want visualized data to show. There are seven components to choose from when visualising your data. Create your own custom device page in Studio to visualize your data.

Live monitoring
Live monitors show real-time machine data. There are five components available for live monitoring. You can add live monitoring components to the same custom device page as historical data components. You can also choose to create a different custom device page for live monitors if you’d rather have them separately.
Custom components
To give you even more options for visualising data, Lenze even allows you to create custom components using third party services. This way you can visualize your machine data in every imaginable way possible.
